Experience counts: Why some veterinarians earn more (or less) than others
In this installment of our veterinary salary series, we look at factors associated with income for seasoned practitioners.


Getty Images
In our last two Eye on Economics columns, we've focused on explaining the variation in starting salaries of new veterinarians, both from year to year (why do veterinarians' incomes change over time?) and within the same year (why do different veterinarians receive different levels of income?). This and the next column will also focus on veterinary salaries, but instead of new grads we'll take a look at current veterinarians-those who've been in the workforce for a number of years. First, let's explore the factors that affect veterinarians' salaries within the same year.
The data for this article comes from the 2000-2014 AVMA Biennial Economic Surveys that have been conducted every two years on a cross section of the profession. The survey collects compensation and demographic data for the previous year, so the time period covered is 1999 to 2013. Table 1 shows the income distribution of survey respondents from only the 2014 survey (2013 salaries), and only includes veterinarians making at least $20,000 per year and working at least 35 hours per week.


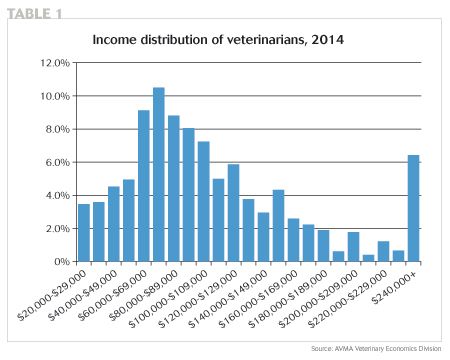
Table 2 examines a regression study of the factors that are correlated with a veterinarian's salary from 1999 to 2013. A level of statistical significance (Sig.) less than 0.05 suggests a 95 percent probability that a factor's coefficient (B) is statistically different from zero and so the factor is likely correlated with salaries. The sign in front of the factor value (B) indicates whether the factor is associated with a salary greater than (+B) or less than (-B) the mean.


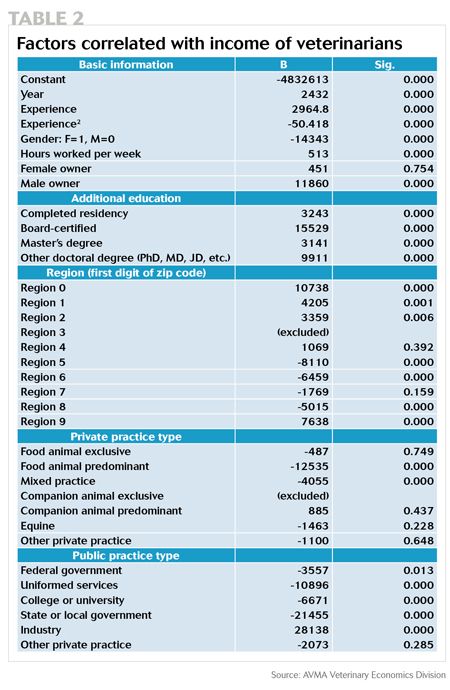
Many of the factors that are correlated with lower or higher income are consistent between current and new veterinarians. These include region of the country, one's species concentration and practice type, and previous experience. In addition, there's a statistically significant difference in pay between men and women in both samples of veterinarians.
However, some of the factors that influence compensation are different for current veterinarians than new veterinarians. For example, new graduates who start out as practice owners right after graduation are so rare that they're not even considered in the AVMA's Senior Survey. Also, by definition, a new graduate cannot be board-certified in a specialty or have taken part in a residency. As evidenced in Table 2, each of these postgraduation factors has an impact on salary. One interesting difference is that additional education does not seem to make any particular difference in starting salaries, but it does matter for current veterinarians.
Let's consider an example demonstrating how to use this table to estimate salaries. Suppose I want to know what a male veterinarian with eight years of experience and a master's degree should make as a companion-animal-predominant practitioner in New Mexico working 40 hours per week. Starting with the constant (-$4,832,613), we add the coefficient value for the year ($2,432) multiplied by the salary year (2015), add the experience ($2,964.8) multiplied by his years of experience (8), add the experience squared (-$50.418) multiplied by his years of experience squared (8x8 = 64), add the value for hours per week ($513) multiplied by 40 hours per week, add (-$14,343) multiplied by 0 for gender, add the educational adjustment for the master's degree ($3,141), and add the region adjustment for Region 8 (-$5,015). We do not add the practice type adjustment for companion-animal-predominant because it is not a statistically significant coefficient. This results in an expected salary for this individual of $107,004.65.
Here's another way to look at it:
Constant -4,832,613 Year 2,432 x 2015 Experience 2,964.8 x 8 Experience squared -50.418 x 64 Weekly hours 513 x 40 Gender -14,343 x 0 Master's degree 3,141 Region -5,015
$107,004.65
Notice that there are excluded values for Region 3 and companion-animal-exclusive practice. These are our baseline variables and their contributions to the model are already included in the constant term.
In the analysis of new veterinarians' starting salaries, age is used to approximate a person's previous experience, but for veterinarians who have been practicing, the better measure is experience, which is calculated as the number of years since graduation minus any years spent out of the veterinary workforce. Experience is clearly an important factor in wage determination, but the estimate shown here likely underestimates its importance. The two experience variables we use, experience and experience squared, are averaged across all 23,276 observations. However, in reality, the learning that any one person gains from experience is unique to that person and not generalizable. No two people have the exact same experience. Though we can measure an average effect of years of experience, this measurement may vary greatly between individuals.
Which leads us to one of the most interesting findings of this analysis. While the regression study of new graduates explains 71 percent of the variation in starting salaries, our similar study of current veterinarians explains only 24 percent of the variation in incomes. What does this mean?
Well, when new veterinarians first enter the job market, they're more or less on the same level. The factors that affect their compensation are easily quantifiable and easily obtained through a survey. But as a veterinarian moves through his or her career, not only do the effects of those quantifiable variables change, they're also able to explain less. The factors that change over time-professional and interpersonal skills, ambition, motivation (none of which is easily measured in a survey)-eventually become more important in explaining the differences in salaries than quantifiable fixed factors.
So what's the key takeaway in all of this? It's good news. Over time, the factors under an individual veterinarian's control are more important to income than factors not under his or her control. According to our study, 76 percent of your income destiny lies squarely in your own hands.
Dr. Ross Knippenberg is an economic analyst for the American Veterinary Medical Association's Veterinary Economics Division. Dr. Mike Dicks is director of the Veterinary Economics Division.